> ## Documentation Index
> Fetch the complete documentation index at: https://controlplanecorporation-kyle-cron-and-quotas.mintlify.site/llms.txt
> Use this file to discover all available pages before exploring further.
# Logs
> Query and visualize workload logs using LogQL across all cloud providers and regions. Includes Grafana integration, live streaming, and 30-day retention.
## Overview
The Logs UI aggregates logs for running [workloads](/concepts/workload) across all configured cloud providers and regions. Logs are displayed in a single view, regardless of where the workload replicas are running.
Use [filters](#log-filters) to investigate issues for a specific [workload](/concepts/workload), [location](/reference/location), or container.
Use [Grafana Explore](https://grafana.com/docs/grafana/latest/explore/) to query, visualize, and analyze log data.
## LogQL
Control Plane logs use LogQL to query log data.
For syntax and query examples, see the [LogQL documentation](https://grafana.com/docs/loki/latest/logql/).
The following labels can be used to create a query:
* container
* gvc
* location
* provider
* replica
* stream
* workload
## Log Filters
Query results can be filtered by the following:
* [Location](/reference/location)
* [Container](/reference/workload/containers)
* Start date and optional end date (the date/time selector includes helper buttons ranging from the `Last 5 minutes` to the `Last 30 days`)
Selecting a [location](/reference/location) or [container](/reference/workload/containers) automatically adds the value to the LogQL query.
## Live Logs
Log streams can be viewed in real time using the `Live` option.
After entering the desired query, click `Live` to begin streaming logs.
Click `Stop` to end the live stream.
## Grafana
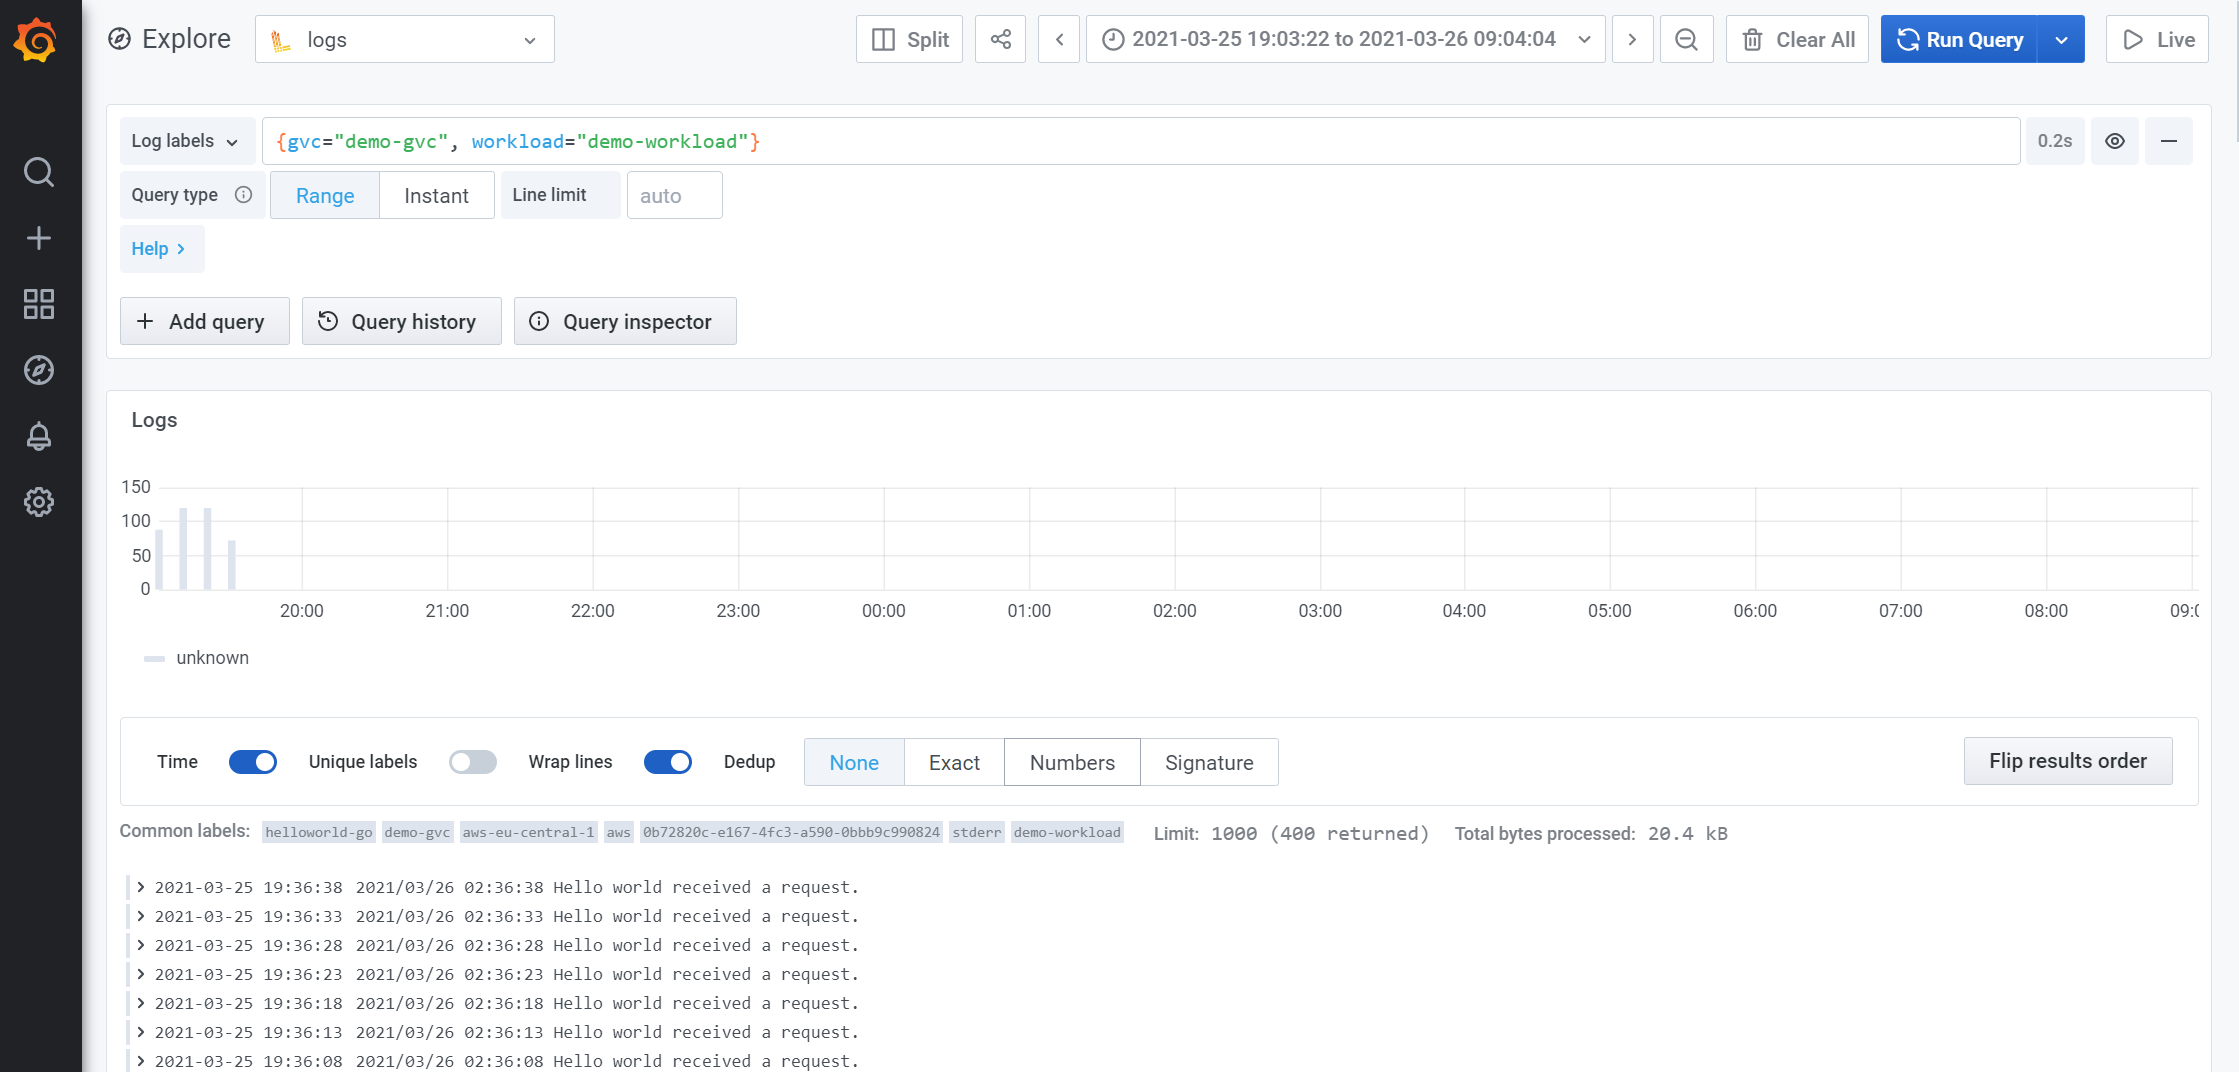
Clicking the `Explore on Grafana` link opens Grafana in a new tab. When you open Grafana from a specific [workload](/concepts/workload), the query is prefilled with the [GVC](/reference/gvc) and [workload](/concepts/workload).
Grafana gives you the ability to "Explore your data through ad-hoc queries and dynamic drill-down. Split view and compare different time ranges, queries, and data sources side by side."
View the [Grafana Explore documentation](https://grafana.com/docs/grafana/latest/explore/).
The following image shows the Grafana UI after executing a query:
 ## Example LogQL Queries
* View the logs for a specific [GVC](/reference/gvc) and [workload](/concepts/workload)
```log Query theme={null}
{gvc="GVC_NAME", workload="WORKLOAD_NAME"}
```
* Access logs with errors
```log Query theme={null}
{gvc="GVC_NAME", workload="WORKLOAD_NAME", container="_accesslog"} |= "\" 50"
```
* Graph access log errors by replica
```log Query theme={null}
sum(count_over_time({gvc="GVC_NAME", workload="WORKLOAD_NAME", container="_accesslog"} |= "\" 50"[1m])) by (replica)
```
* Graph access log errors by workload
```log Query theme={null}
sum(count_over_time({gvc="GVC_NAME", container="_accesslog"} |= "\" 50"[1m])) by (workload)
```
* View the logs for a GVC, workload, location, and container
```log Query theme={null}
{gvc="GVC_NAME", workload="WORKLOAD_NAME", location="aws-eu-central-1", container="CONTAINER_NAME"}
```
* View logs across all workloads and GVCs
```log Query theme={null}
{gvc=~".+"}
```
* Count inbound requests by IP
This query produces a count of inbound requests grouped by source IP address over the last 10 minutes.
Set the Grafana query type to `Instant` so the results can be returned as a sortable list.
```log Query theme={null}
sum(count_over_time({gvc="GVC_NAME", workload="WORKLOAD_NAME", container="_accesslog"} | logfmt | regexp "(?P\\d+\\.\\d+\\.\\d+\\.\\d+)"[10m])) by (ip)
```
* Count inbound requests by path
This query returns the count of inbound requests grouped by request path for the last 10 minutes where latency exceeds 100ms.
Set the Grafana query type to `Instant` so the results can be returned as a sortable list.
```log Query theme={null}
sum(count_over_time({gvc="GVC_NAME", workload="WORKLOAD_NAME", container="_accesslog"} | logfmt | regexp "(?P\\/[^\"]*\\s).+\\d+ \\d+ \\d+ (?P\\d+) " | latency > 100 [10m])) by (workload, path)
```
## Log Retention Policy
Logs are stored for 30 days by default. The retention period can be adjusted for each [org](/reference/org).
Learn how to [configure log shipping to an external provider](/external-logging/overview).
## CLI
To view the CLI documentation for logs, see the [Logs CLI reference](/cli-reference/commands/logs).
## Example LogQL Queries
* View the logs for a specific [GVC](/reference/gvc) and [workload](/concepts/workload)
```log Query theme={null}
{gvc="GVC_NAME", workload="WORKLOAD_NAME"}
```
* Access logs with errors
```log Query theme={null}
{gvc="GVC_NAME", workload="WORKLOAD_NAME", container="_accesslog"} |= "\" 50"
```
* Graph access log errors by replica
```log Query theme={null}
sum(count_over_time({gvc="GVC_NAME", workload="WORKLOAD_NAME", container="_accesslog"} |= "\" 50"[1m])) by (replica)
```
* Graph access log errors by workload
```log Query theme={null}
sum(count_over_time({gvc="GVC_NAME", container="_accesslog"} |= "\" 50"[1m])) by (workload)
```
* View the logs for a GVC, workload, location, and container
```log Query theme={null}
{gvc="GVC_NAME", workload="WORKLOAD_NAME", location="aws-eu-central-1", container="CONTAINER_NAME"}
```
* View logs across all workloads and GVCs
```log Query theme={null}
{gvc=~".+"}
```
* Count inbound requests by IP
This query produces a count of inbound requests grouped by source IP address over the last 10 minutes.
Set the Grafana query type to `Instant` so the results can be returned as a sortable list.
```log Query theme={null}
sum(count_over_time({gvc="GVC_NAME", workload="WORKLOAD_NAME", container="_accesslog"} | logfmt | regexp "(?P\\d+\\.\\d+\\.\\d+\\.\\d+)"[10m])) by (ip)
```
* Count inbound requests by path
This query returns the count of inbound requests grouped by request path for the last 10 minutes where latency exceeds 100ms.
Set the Grafana query type to `Instant` so the results can be returned as a sortable list.
```log Query theme={null}
sum(count_over_time({gvc="GVC_NAME", workload="WORKLOAD_NAME", container="_accesslog"} | logfmt | regexp "(?P\\/[^\"]*\\s).+\\d+ \\d+ \\d+ (?P\\d+) " | latency > 100 [10m])) by (workload, path)
```
## Log Retention Policy
Logs are stored for 30 days by default. The retention period can be adjusted for each [org](/reference/org).
Learn how to [configure log shipping to an external provider](/external-logging/overview).
## CLI
To view the CLI documentation for logs, see the [Logs CLI reference](/cli-reference/commands/logs).